
WebGPU Inspector
Featured
WebGPU Inspector Debugging Tools
Overview
What is WebGPU Inspector?
WebGPU Inspector Debugging Tools.
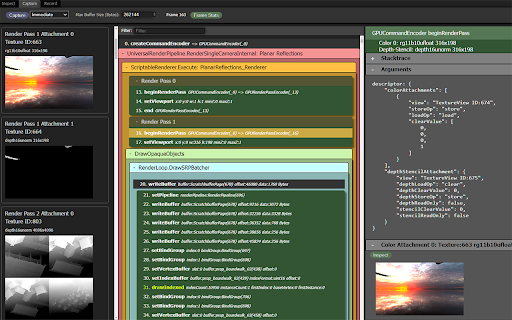
SCREENSHOT

SUMMARY
WebGPU Inspector is a Chrome Developer Tools extension for debugging WebGPU content. It intercepts all WebGPU objects and commands, allowing you to inspect information about any GPU object.
* Inspect any WebGPU object, with a stacktrace for where it was created.
* Catch errors compiling shader modules and pipelines.
* Display textures,.
* Edit shaders live on the page to debug and test shader changes.
* Plot frame times and GPU object counts over time for profiling information.
* Capture and inspect all WebGPU commands used to render a frame, including the texture results of each render pass.
* View uniform and storage buffer content used for draw and dispatch calls.
* Record all commands and data used to render a set of frames, generating a standalone HTML file that can recreate the render.
See More
Stats
Trends for WebGPU Inspector:
Rank
User count
Category Rank
Rating
Download
HOW TO INSTALL WebGPU Inspector FROM A CRX FILE
- Download WebGPU Inspector CRX file
- NOTE: Sometimes the browser may block downloading / installing CRX file from outside the Chrome Web Store. If so, you may need to download the ZIP file instead
- In the URL bar, go to chrome://extensions
- Enable Developer mode
Ratings
USER REVIEWS (0)
No reviews
